The Two Clocks — Why Zero-Sum Behavior Is Usually Correct
Download as PDF · slide deck (10 slides, PPTX)
Zero-sum behavior is usually described as a failure of character, and the implied remedy is cooperation. This essay argues that it is normally a correct reading of a real constraint. Every capacity constraint has a physical clock, set by fabs, shipyards, transformers and interconnection queues. Every allocation decision has a decision clock, set by board tenure and budget cycles. When the second runs shorter than the first, the person allocating lives entirely inside a window where supply genuinely cannot move, and share is the only variable there is. Three cases carry the argument — the 3G spectrum auctions of 2000, container shipping through the pandemic, and fifty years of memory cycles — and four conditions explain why the same industries then overshoot into a glut. The fight and the glut turn out to be the same fact, seen from inside and from outside.
I.
A data center campus that joined the utility interconnection queue in Northern Virginia, Phoenix, or Dallas this year can expect to wait 4 to 7 years for power. The capital is committed. The construction is unremarkable. The constraint sits in the queue and in the equipment: a large power transformer that took 7 to 14 months to source before the pandemic now takes 3 years, and the largest high-voltage units take 4.
So the operators are not competing for money, and they are not competing for silicon. They compete for position in a queue. Every position one of them takes is a position another cannot have.
Watch how that gets described. Hoarding. Land grab. Winner-take-all. The vocabulary implies a failure of character, and the implied remedy is cooperation. But there is nothing to cooperate about. Inside a queue with a fixed clearing rate, share is the only variable there is.
This is the part of zero-sum thinking that the moral framing misses. Most of the time, the people behaving as though the pot were fixed have read their situation correctly. The pot really is fixed. What they get wrong is not the scarcity. It is the expiry date.
II.
Where this started
I began thinking about this during the pandemic, watching the shortages become a daily broadcast item. CNBC and Bloomberg ran the story every morning for the better part of two years: something was short, a price had moved, someone was blaming someone. Chips, containers, lumber, port slots. The segments were well reported and the explanations were almost always about behavior. Somebody had hoarded, somebody had gambled, somebody had failed to plan.
At the same time I was watching TradeLens from inside IBM. Maersk and IBM had built it as an open, neutral platform for container shipping data, and it was running through exactly the period when that industry was rationing capacity and printing record profits. The venture closed in November 2022. The stated reason was that full global industry collaboration had not been achieved. Analysts pointed at neutrality: competing carriers were unwilling to route operational data through a network co-owned by their largest rival. So here was a deliberate, well-funded, technically successful attempt at a positive-sum arrangement, and it died of the participants’ unwillingness to be seen by each other.
Two older cases had been sitting unresolved for much longer. The 3G auctions of 2000, which I watched from the vendor side, and the memory cycle, which I had watched repeat for most of my career.
Neither had an explanation I found satisfying. For 3G, the standard reading blamed the auction design, and specifically the charge that the UK had optimized for Treasury revenue rather than for sound regulation of an industry. That may be partly true. But a well-run auction extracts the value that bidders themselves place on the asset, so the design does not explain why the bidders placed that value on it. Nor does it explain Germany, which used a different mechanism and reached a comparable number.
For DRAM, the standard reading was that this is simply how capital-intensive industries behave. That names the pattern rather than accounting for it. It does not explain why planners who lived through the previous cycle repeat it, and it predicts nothing about when.
What eventually struck me was that each explanation was local to its own case. Auction design accounted for 3G and for nothing else. Capital intensity accounted for memory and for nothing else. Yet the shape was the same in container shipping, which had no auction and no fab. Something common was producing it, and it was not the mechanism, the industry, or the character of the people involved.
III.
Two clocks, running at different speeds
A word on what I mean by zero-sum, because the term gets used loosely. In the strict sense, a situation is zero-sum when the total is fixed, so that whatever one party gains another loses. That is a claim about a quantity, not about anyone’s outlook. It is different from zero-sum thinking, which describes a disposition to treat every situation that way, and the two get run together constantly. My argument concerns the first. It is also a claim about intervals rather than about whole games: trade is positive-sum over decades, and the vessel capacity available in March 2021 was fixed. Both are true, and the interval is where people actually decide.
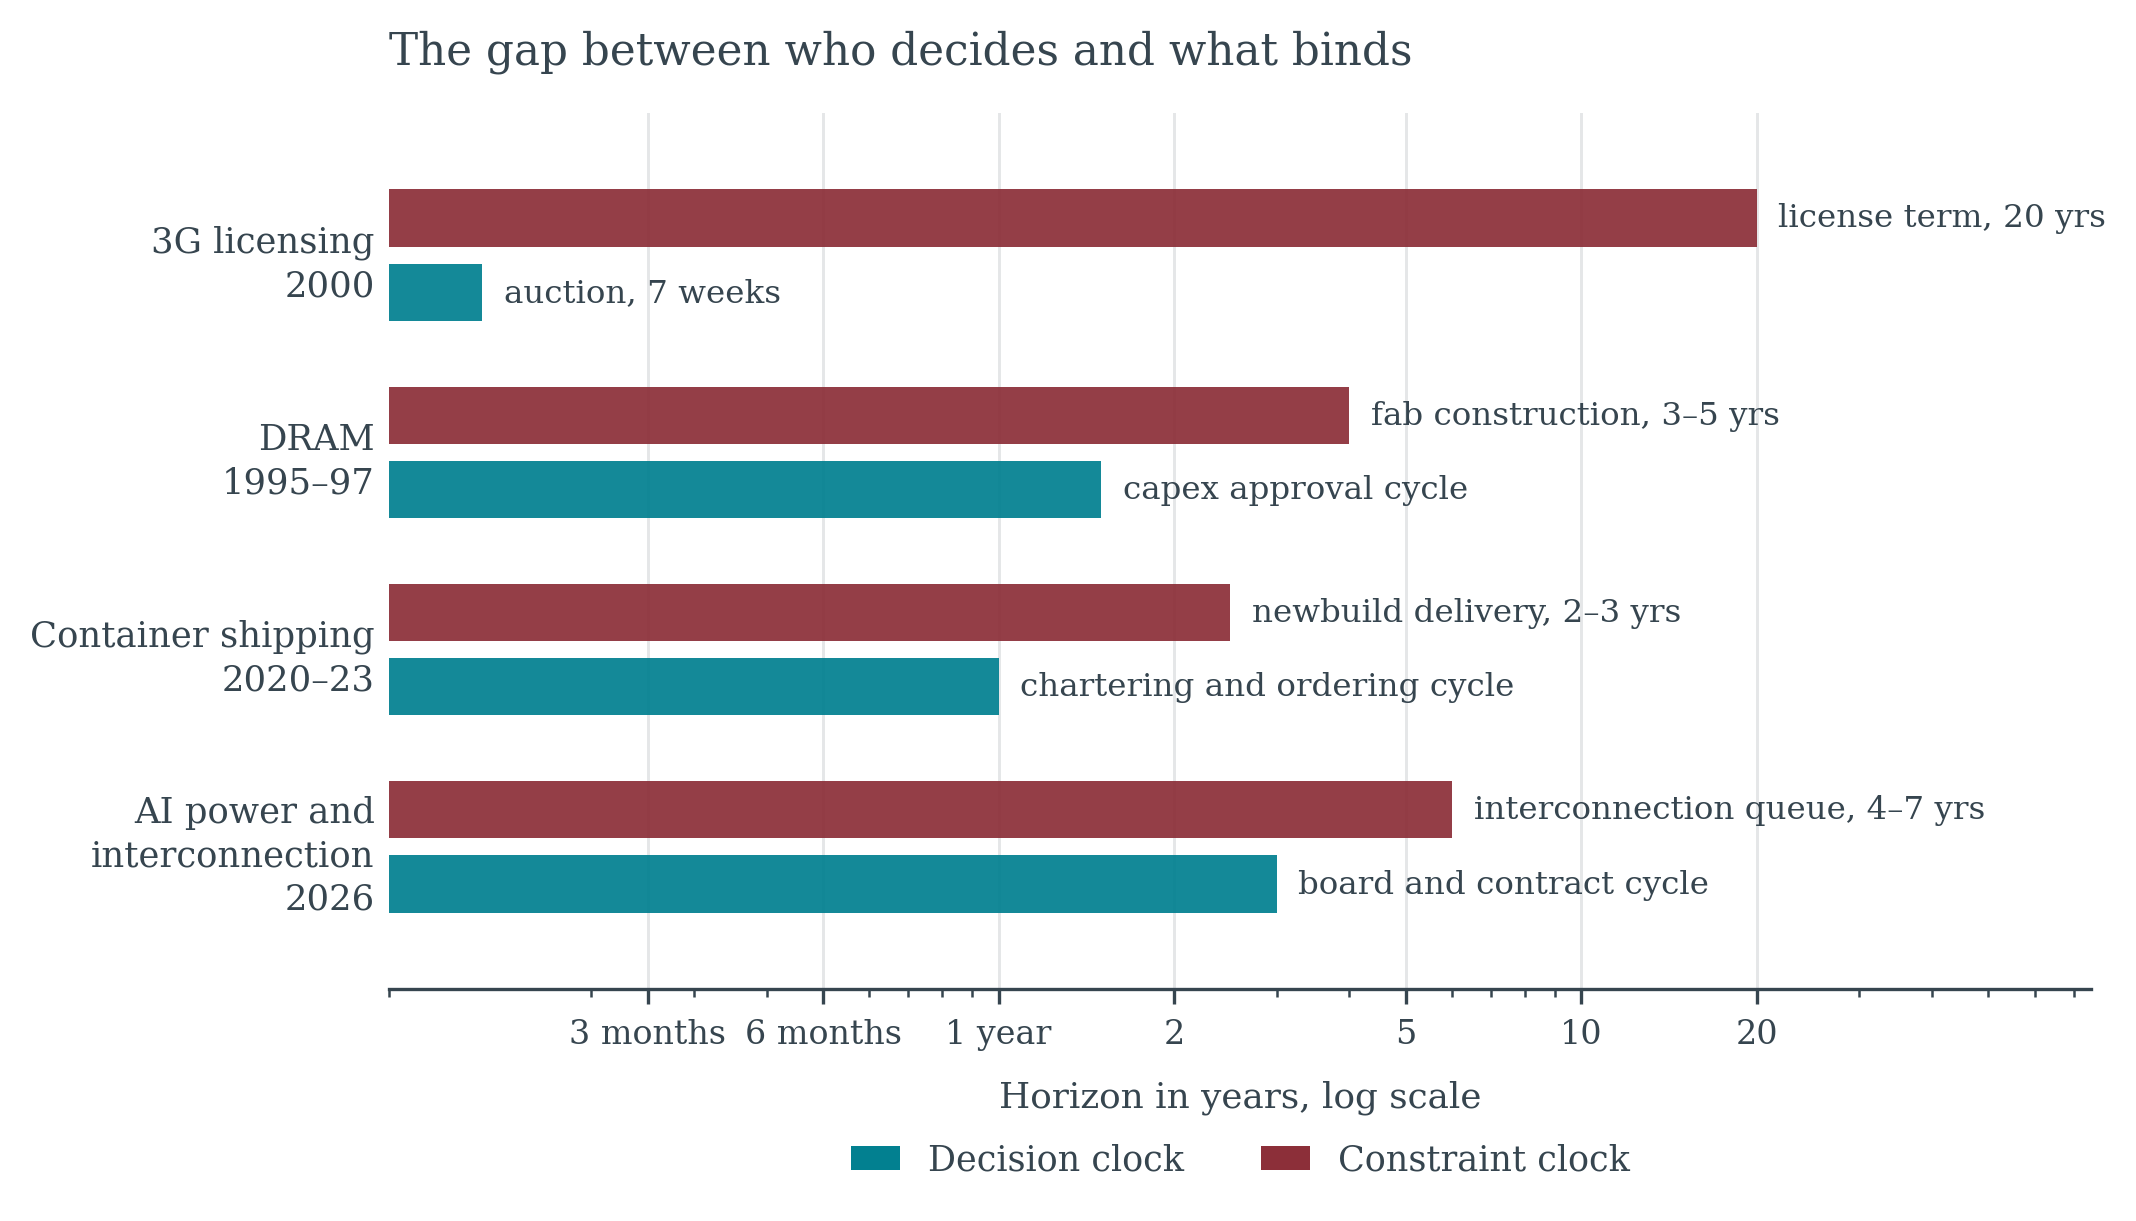
Every capacity constraint has a physical clock. Fabs take 3 to 5 years. Container ships take 2 to 3. Large transformers and turbine slots run longer, and the interconnection queue behind them longer still. Skilled labor pipelines run 5 to 7 years and cannot be ordered at all. These durations are not estimates or moods. They are engineering facts, and everyone in the industry knows them.
Every allocation decision also has a decision clock. Board tenure, budget cycles, incentive plans, ministerial terms, the patience of a capital market. 2 to 4 years, typically.
When the decision clock runs shorter than the constraint clock, the person allocating lives entirely inside the fixed-supply window. The expansion that would make the situation positive-sum arrives after they have left. Asking them to act on it asks them to spend a real budget today for a payoff credited to a successor.
That gap is the structure underneath zero-sum behavior. In a large class of capacity-constrained markets, zero-sum behavior is not a moral or cognitive failure. It is a rational response to a fixed-supply interval, and the interval has a measurable length.
Zero-sum is not an attitude. It’s a duration.
IV.
A market designed to be zero-sum
In April 2000 the United Kingdom auctioned five third-generation mobile licenses and raised £22.5 billion. Germany followed in August and raised roughly €50 billion.
The number of licenses was fixed by the regulator, so the contest was distributive by design. There was no way for a bidder to expand the supply, and no way to succeed except at a rival’s expense. Incumbents bid to protect existing second-generation revenue as much as to acquire anything new, which sharpened the contest further: losing meant more than not winning.
Look at the two clocks. The bidding ran seven weeks. The licenses ran 20 years. Bidders had to price two decades of scarcity on a few weeks of information, and the price they set assumed that the scarcity of 2000 would persist across the term.
It did not, and it failed in the least convenient direction. The networks arrived years late, and the applications that justified the spectrum arrived later still. The operators who had paid the most emerged with balance sheets that constrained the rollout the licenses existed to fund. The scarcity was real on the day of the auction. Its duration was the thing nobody could price, and the auction gave nobody time to try.
V.
The mechanism in plain sight
Container shipping ran the same shape in public, at a speed anyone could follow.
Spot rates on Drewry’s composite index averaged $1,420 per forty-foot container in 2019. In September 2021 the index peaked at $10,377.
Inside that window, allocation was the whole game. Small importers could not outbid large ones for a slot. Carriers moved capacity onto premium lanes and away from thin ones. Cargo that could not pay simply did not move. Nobody involved was being irrational or greedy. For roughly 2 years the supply of vessel capacity was fixed by physics, and share was the only thing left to contest.
The same period produced the sharpest allocation story in manufacturing. Automakers canceled foundry orders in the spring of 2020, expecting a collapse in vehicle demand, and in doing so surrendered their position in the queue. The queue turned out to be the asset. Mature-node capacity carried margins too thin to justify building on speculation, so nobody had built any, and the automakers spent the next 2 years bidding against consumer electronics for slots that no amount of money could conjure. A two-quarter decision met a multi-year constraint.
Then the ships arrived. Carriers ordered through the peak, and by late 2022 the order book reached roughly 30% of the existing fleet. Deliveries set records in 2023 and again in 2024. Between 2019 and 2023 the container fleet grew 21% while container volumes grew 4%. By September 2023 the index had fallen to $1,479, 86% below the peak and back to within a few percent of where it started.
Everyone was right about the shortage. Everyone was wrong about the calendar, and the calendar was set by the shipyards.
VI.
The cycle nobody has explained
Memory has run this pattern for 50 years, and it is the case that shows the mechanism is structural rather than a lapse.
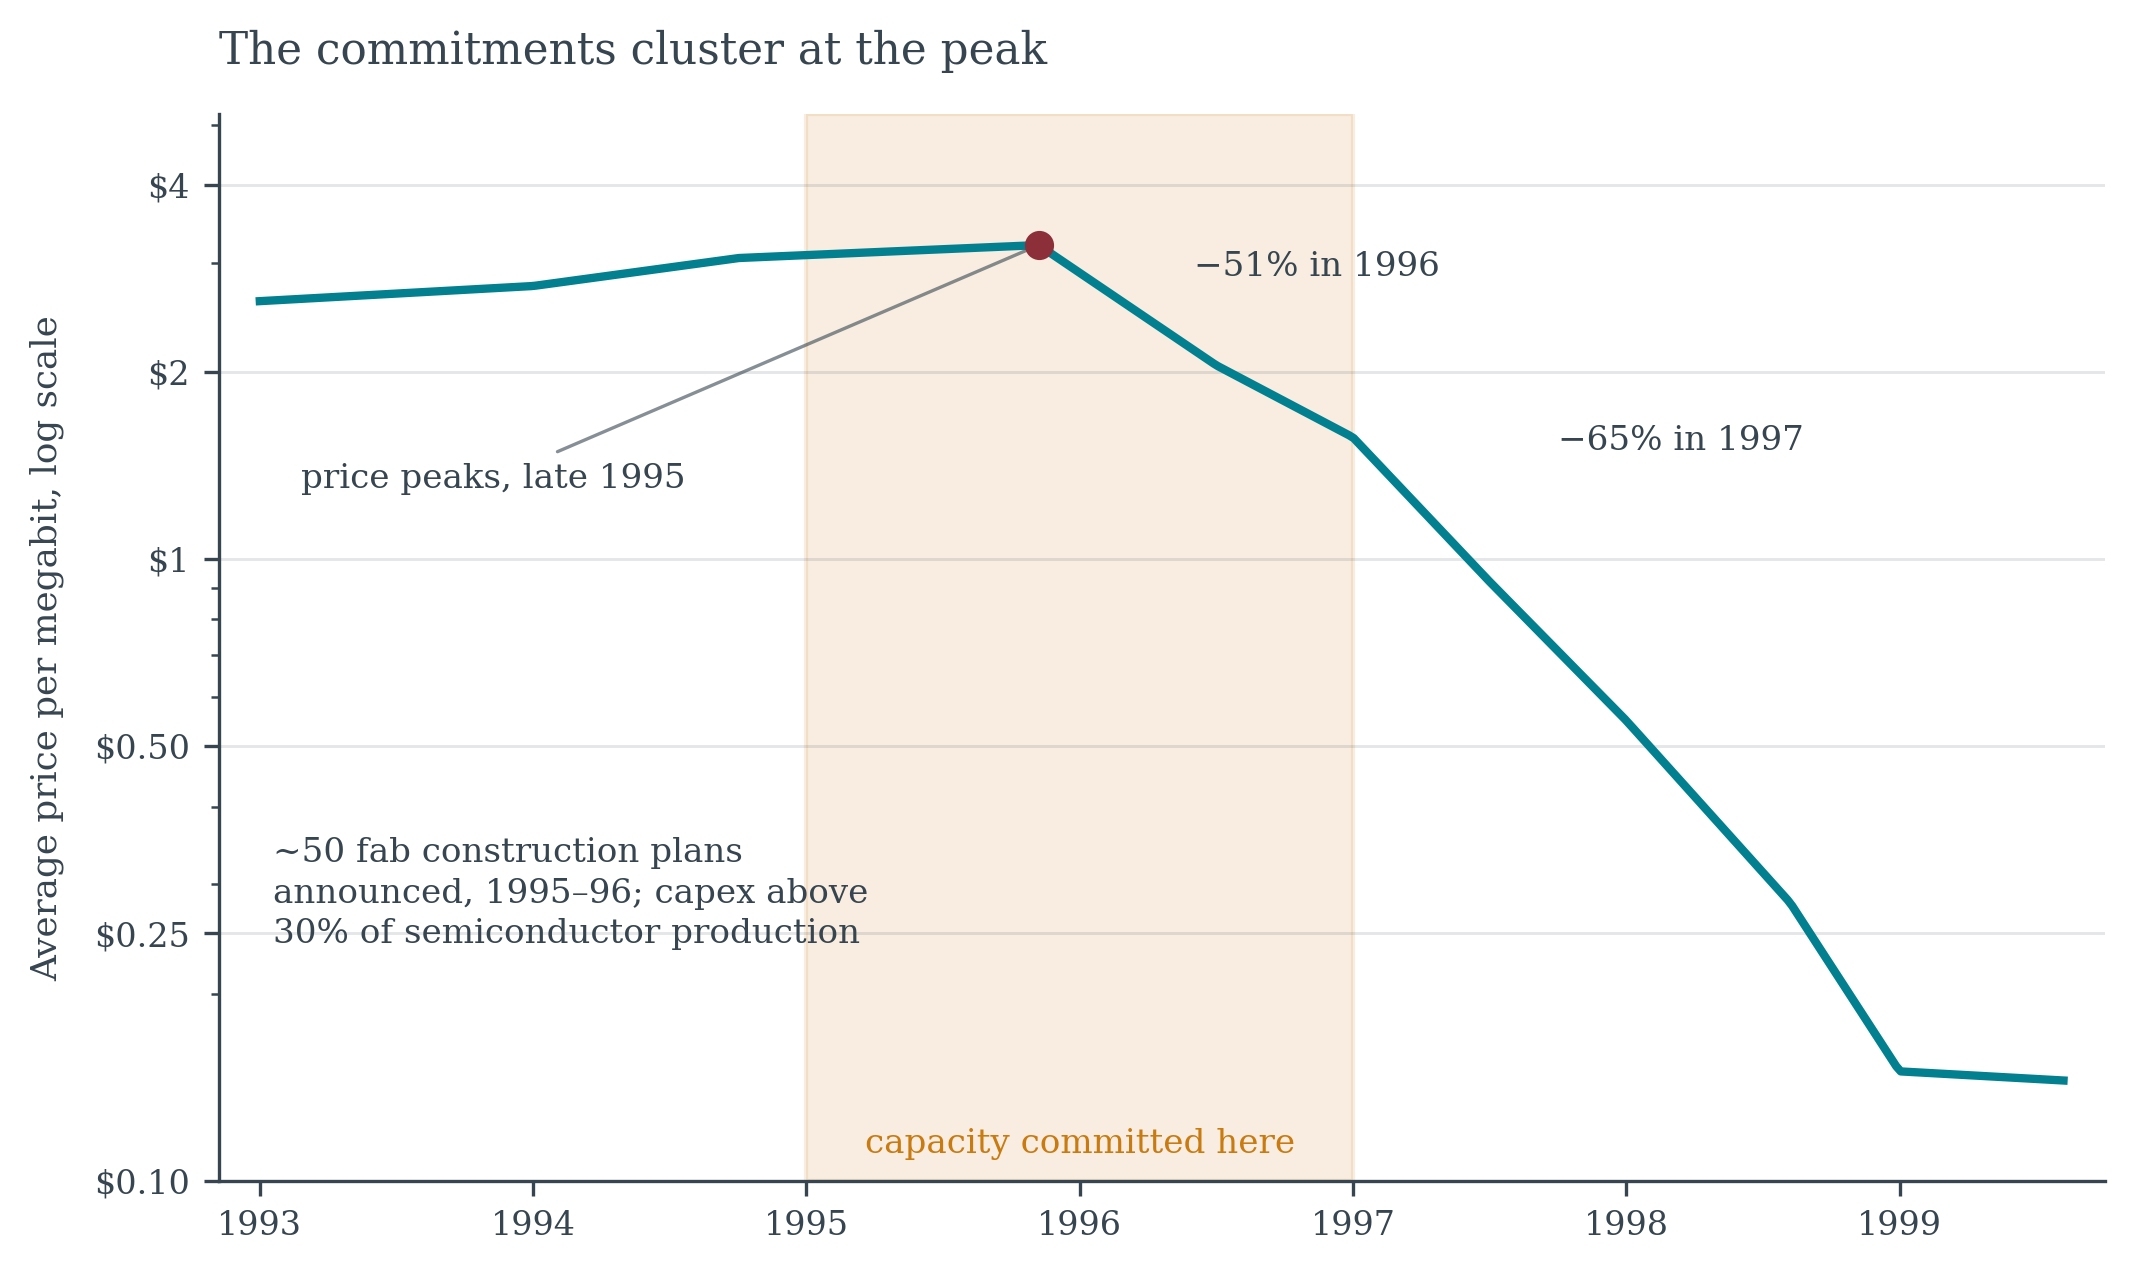
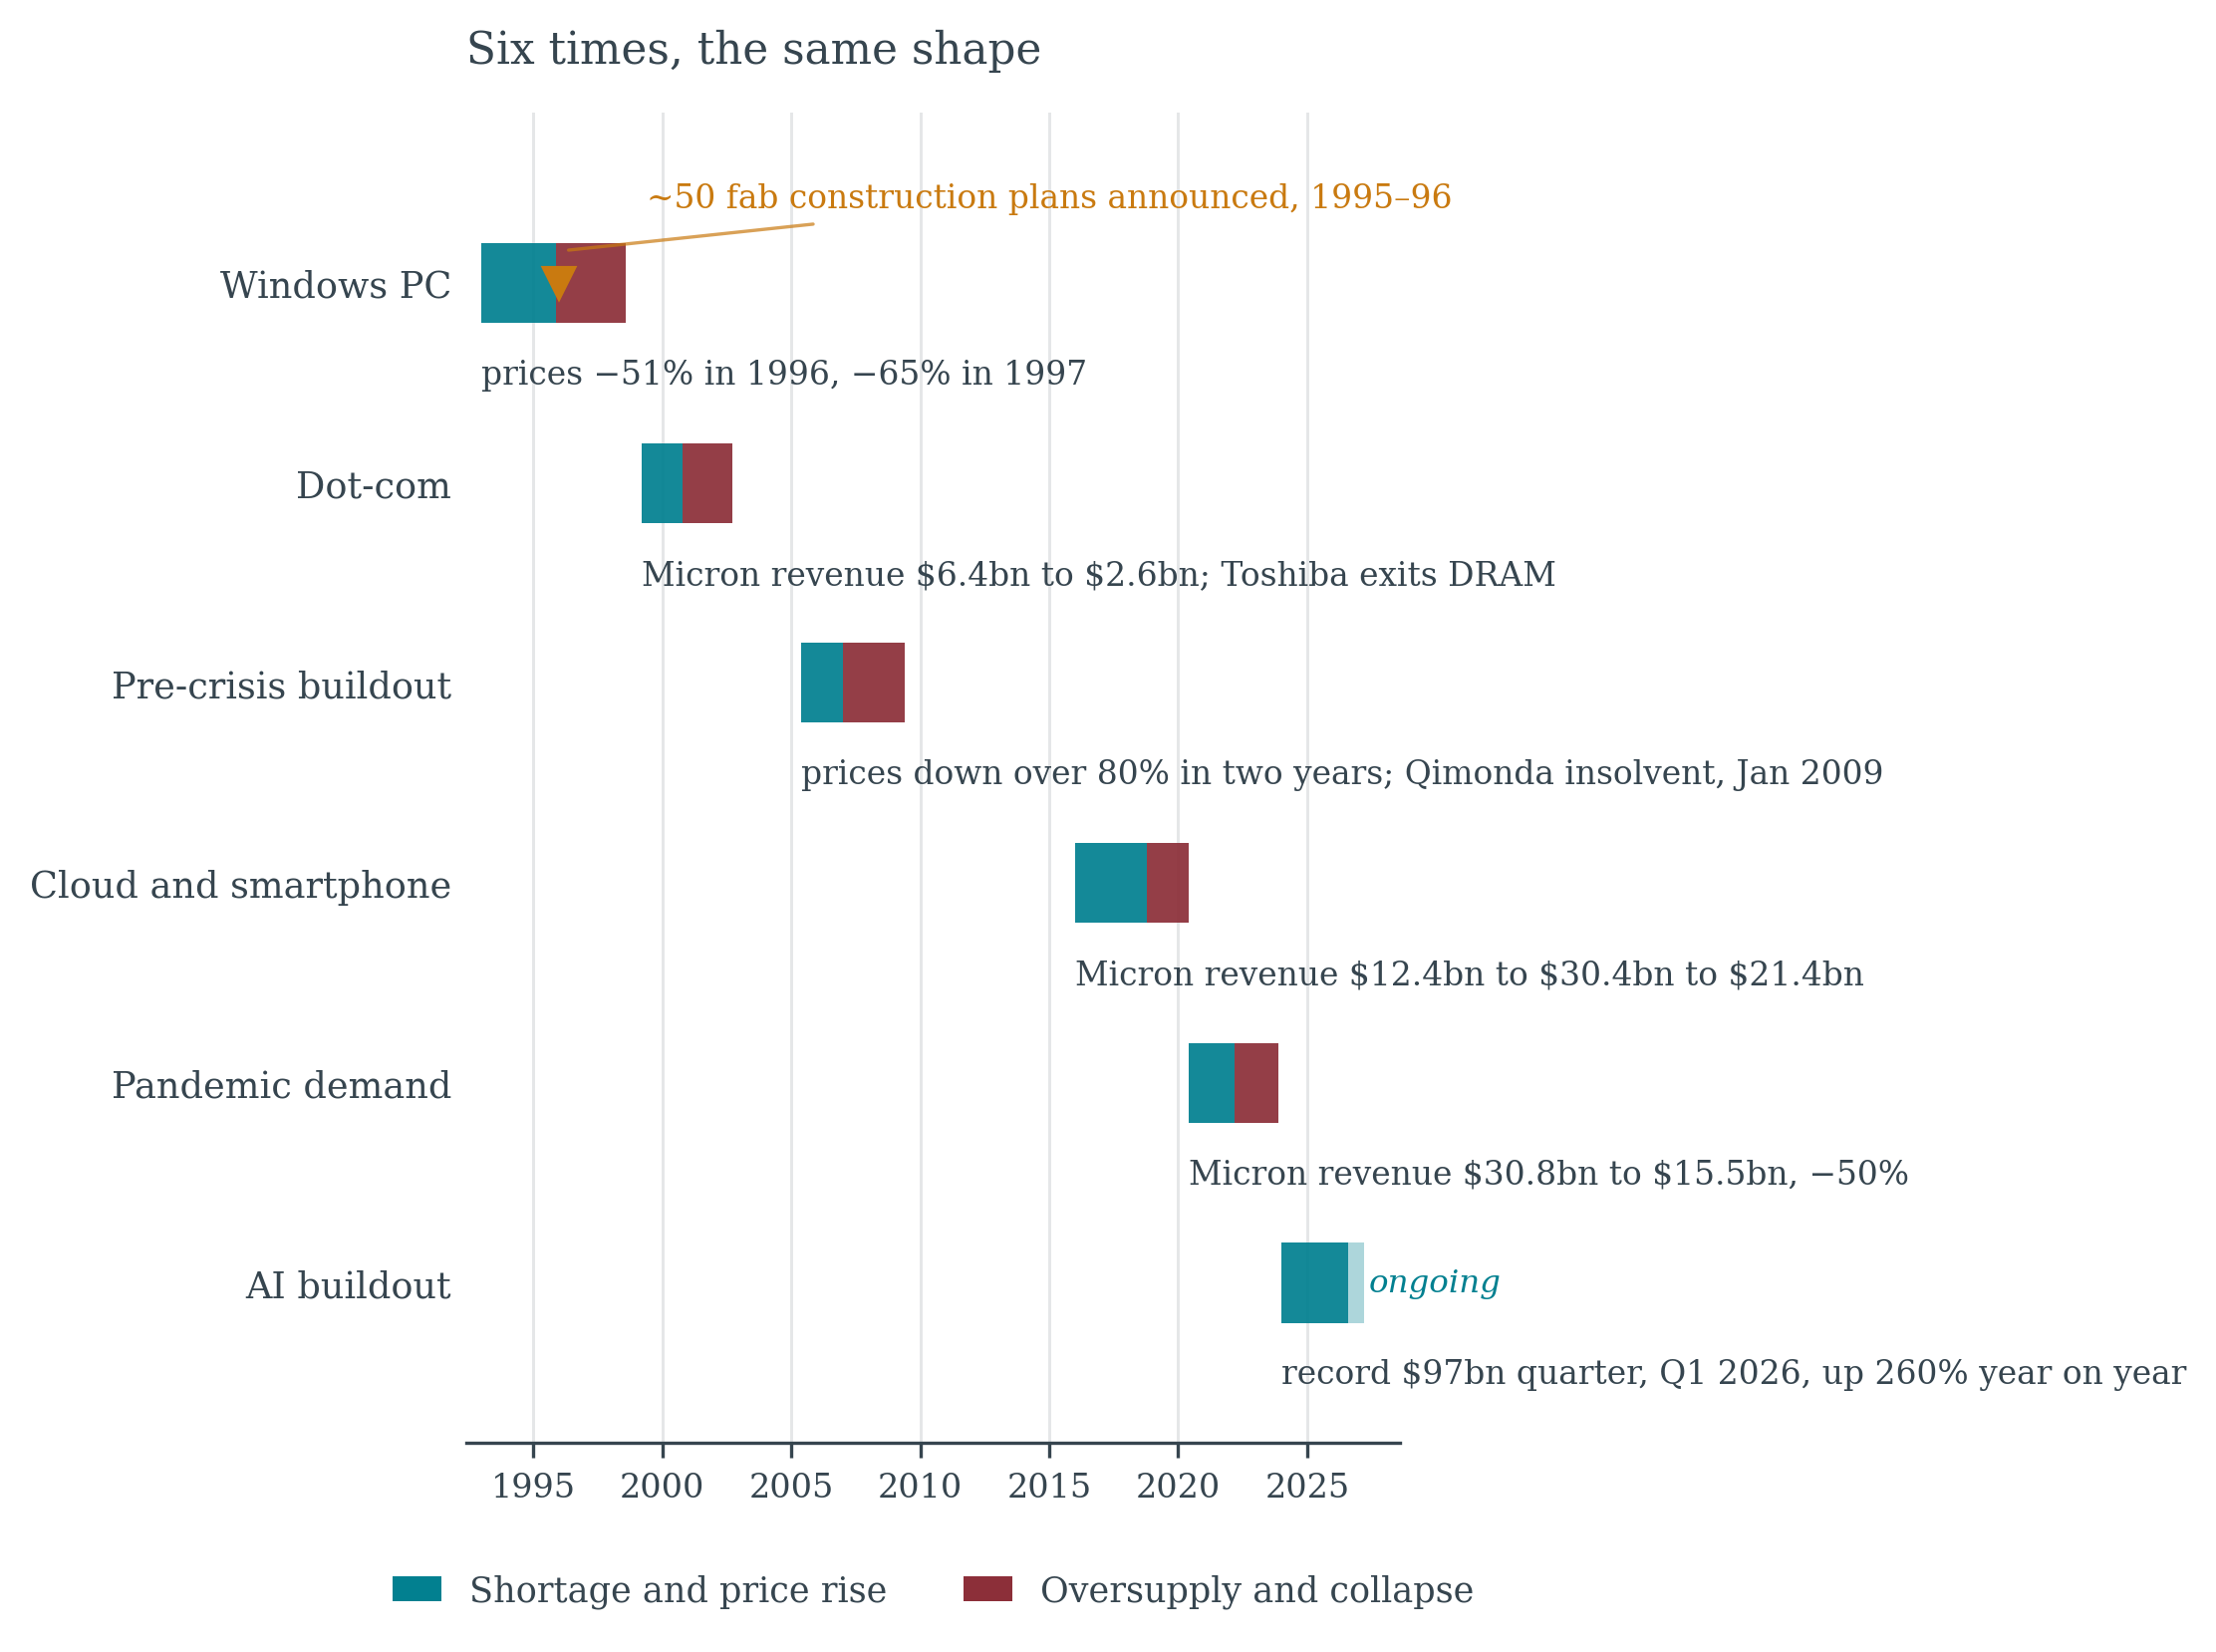
Office automation drove a 6-year shortage from 1990: the DRAM market grew from $7 billion to $41 billion, and leading suppliers held gross margins above 50%. The industry responded exactly as anyone would. Roughly 50 fab construction plans were announced across 1995 and 1996, and capital expenditure passed 30% of semiconductor production.
Prices peaked in late 1995. They fell 51% in 1996 and another 65% in 1997. The 16-megabit part went from about $70 wholesale to about $7 within a year.
Then it happened again. And again. 1988, 1995, 2007, 2017, the pandemic build and its 2023 collapse — and as of 2026 the industry sits in another shortage, with talk of wafer constraints running to the end of the decade.
The textbook explanation is the cobweb model, formalized by Ezekiel in 1938 and anticipated by Tinbergen’s account of the shipbuilding cycle 7 years earlier. In it, producers extrapolate today’s price into tomorrow’s demand and the lag does the rest. The trouble is that the model’s naive expectations were exactly what Muth wrote against in 1961, and rational expectations answer it: agents who understand the model should not be fooled by it, and the oscillation should damp out. Nerlove’s adaptive expectations and the later nonlinear work on persistent cobweb oscillation both narrow the gap without closing it.
So the puzzle is not that economists failed to notice. It is that the sophisticated version predicts the cycle should have stopped, and it has not. The people running memory fabs are among the most capable capacity planners in industry, every one of them lived through the previous cycle, and they do it again anyway. Sophistication is not the variable.
Four conditions are, and each has a literature behind it. Where all four hold together, overshoot is not an error. It is the equilibrium.
First: commitment is irreversible. A half-built fab cannot be resold as a fab. Neither can a hull, or a substation.
Second: the lead time is long and publicly known. Everyone can say out loud that it takes 3 years.
Third: the signal is public and simultaneous. The same price spike reaches every participant in the same week, through the same trade press.
Fourth: commitments are unobservable until they land. Nobody can see what the others are ordering in time to adjust.
The fourth condition is the one that looks removable, and TradeLens, the Maersk and IBM data-sharing platform for container shipping, is the reason I no longer think it is. Making commitments and flows visible across an industry is a solvable engineering problem, and the platform solved it. What defeated it was governance: the participants would not accept visibility on terms set by a rival. The information structure held not because anyone lacked the technology to change it, but because changing it required a neutrality that the industry could not construct. That is worth remembering whenever a shortage prompts a call for better industry-wide data sharing.
Given all four, the rational move for each participant is to commit early and commit large. Arriving late into a genuine shortage costs more than arriving on time into a glut, because in a shortage you lose the customer and in a glut you keep them at a worse price. Every participant runs that calculation, correctly, and the aggregate of correct individual calculations overshoots.
Investors reached the second half of this from their own direction. The capital cycle, set out in Edward Chancellor’s Capital Returns, holds that supply rather than demand drives returns: high returns pull in capital, capacity follows, and the returns die. That is the glut, described from outside by someone deciding whether to buy the stock. The question here is the one that framework does not need to answer, which is why the participants inside cannot avoid producing it.
This is the same structure that produced the fight. The window of fixed supply is what makes the near-term contest distributive, and the length of that window is what makes the capacity arrive all at once at the end of it. The fight and the glut are the same fact seen from inside and from outside.
VII.
The lead-time test
Four questions do most of the work when a conflict starts to look zero-sum. They map onto the four conditions, one for each.
What is the slowest physical constraint, and what is its lead time? Usually not the one being discussed. In the AI buildout the conversation runs on chips, while the binding constraint is a transformer, a switchgear line, and a place in a utility queue.
How long is the decision horizon of the people allocating? If it is shorter than the constraint, expect distributive conflict, and expect it to be rational. Appeals to cooperate inside that window ask people to ignore accurate information.
Once committed, can the capacity be unwound? Reversible commitments allow correction as the picture changes. Irreversible ones convert a forecast into a fact on the ground, and the forecast was made at the least reliable moment.
Can the participants observe each other’s commitments? If not, expect the overshoot no matter how experienced they are. The overshoot is a property of the information structure, not of the people.
The test sits on the supply side of the scenario toolkit. Where the depth test asks where in a stack an advantage really lives, and the trilemma test asks which of three goods a design has quietly given up, this one asks how long a constraint has left to run. All three do the same job in different registers: they turn an argument about motives into a question with an answer.
VIII.
The bet being placed now
Grid interconnection in the largest markets is running 4 to 7 years. GPU allocation can be reassigned between sites in months. The binding constraint and the decision horizon differ by a factor of 5 or more, and the contracts being signed this year price today’s allocation ranking as though it were durable.
That is the bet the operators made when they bid for 3G licenses in the spring of 2000. Not that the scarcity was real, because it was, but that it would still be there when the bill came due.
I take no position here on whether the current buildout is oversized. That question needs demand forecasts I do not have and would not trust. The claim is narrower and, I think, harder to argue with: the conflict over allocation is correct, the overshoot at the end of it is also correct, and both follow from the same lead time.
Scarcity does not end because people learn to cooperate. It ends because the lead time runs out. Everything before that is allocation, and allocation is a fight.
Sources and notes
Mike Edholm has spent three decades advising corporations and institutions on scenario planning and strategic foresight, with assignments spanning telecommunications, computing, industrial automation, and international development. This essay is part of a series on scenario planning methodology.